The Dashboard panels
The Dashboard gathers your business’s indicator panels. In the side menu you pick a panel, and at the top of each one are the filters for period and date (execution, due or payment). Here’s what each panel shows.
The panels, one by one
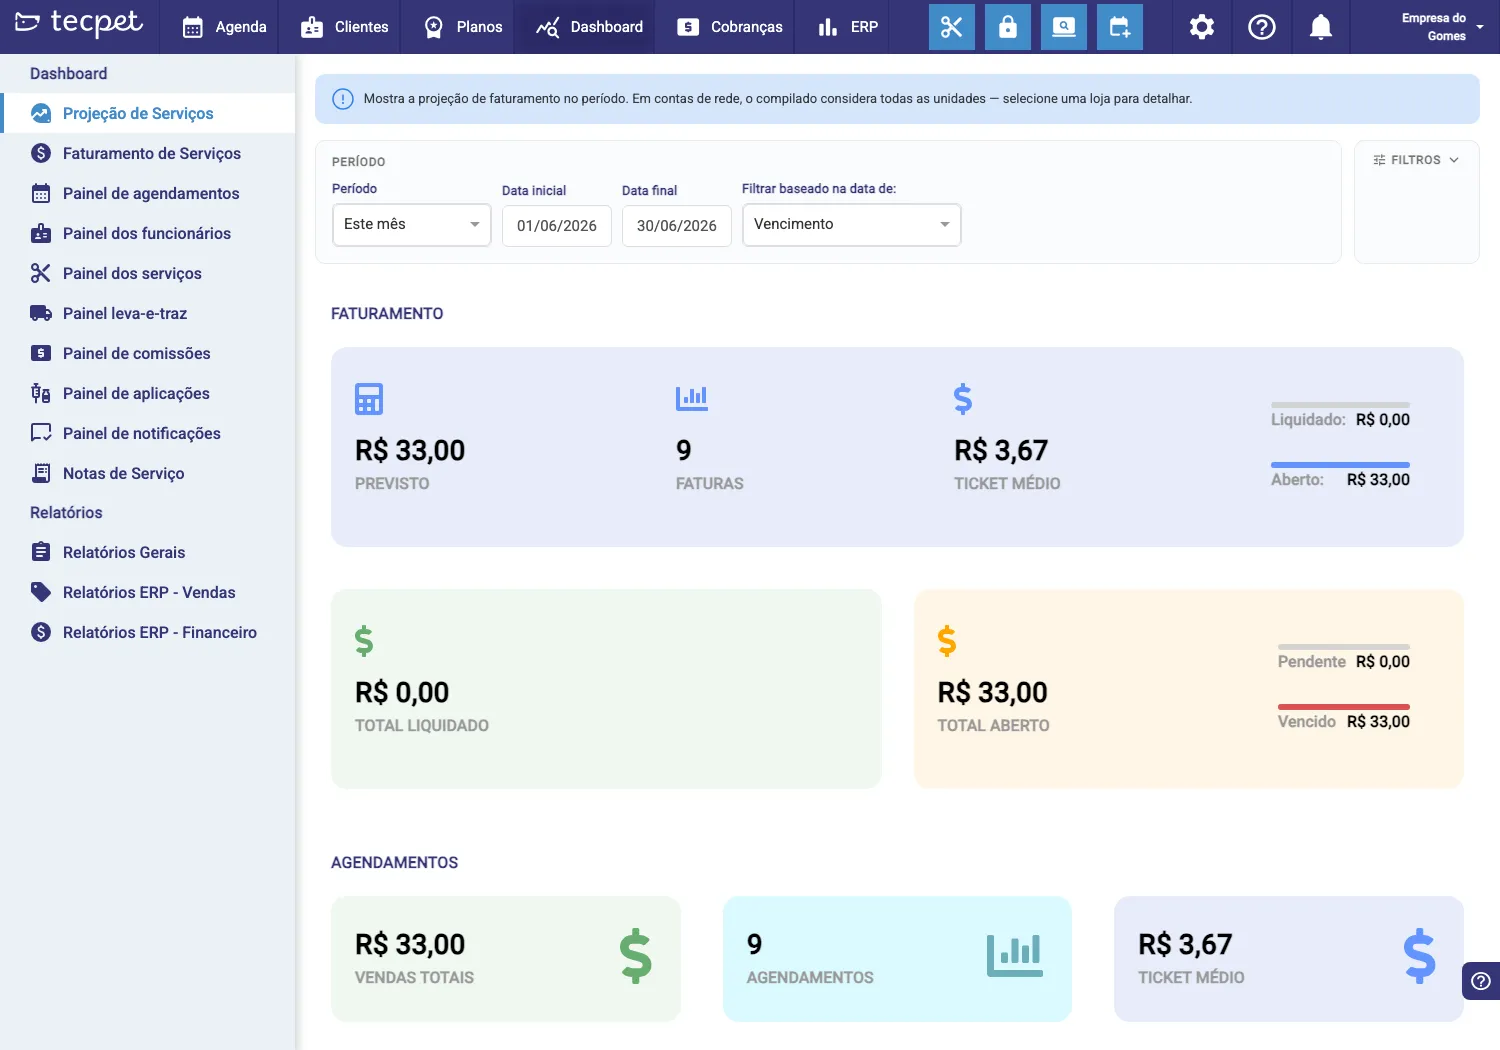
Section titled “The panels, one by one”- Projection / Service revenue — the period’s revenue: forecast, number of invoices, average ticket, total settled and open, and the sales and appointments summary;
- Receipts panel — what came in (payments), by period and payment method;
- Appointments panel — appointment volume, by status and by day;
- Staff panel — productivity per professional (visits, revenue);
- Services panel — which services sell most and generate revenue;
- Pickup & delivery panel — visits with transport (pickup and drop-off);
- Commissions panel — the commissions per staff member in the period;
- Applications panel — the vaccines/applications (Pet Care) applied and due;
- Notifications panel — what was sent via WhatsApp and the result;
- Service Notes and General Reports — detailed reports; and, with the ERP module, the ERP Reports (Sales and Finance).
Filters
Section titled “Filters”At the top of each panel you adjust:
- Period (This month, Today, etc.) with start and end date;
- Filter by the date of — Execution (when the service was done), Due or Payment;
- and each panel’s extra Filters.
Changing the period recalculates all numbers instantly.
What changes by account type
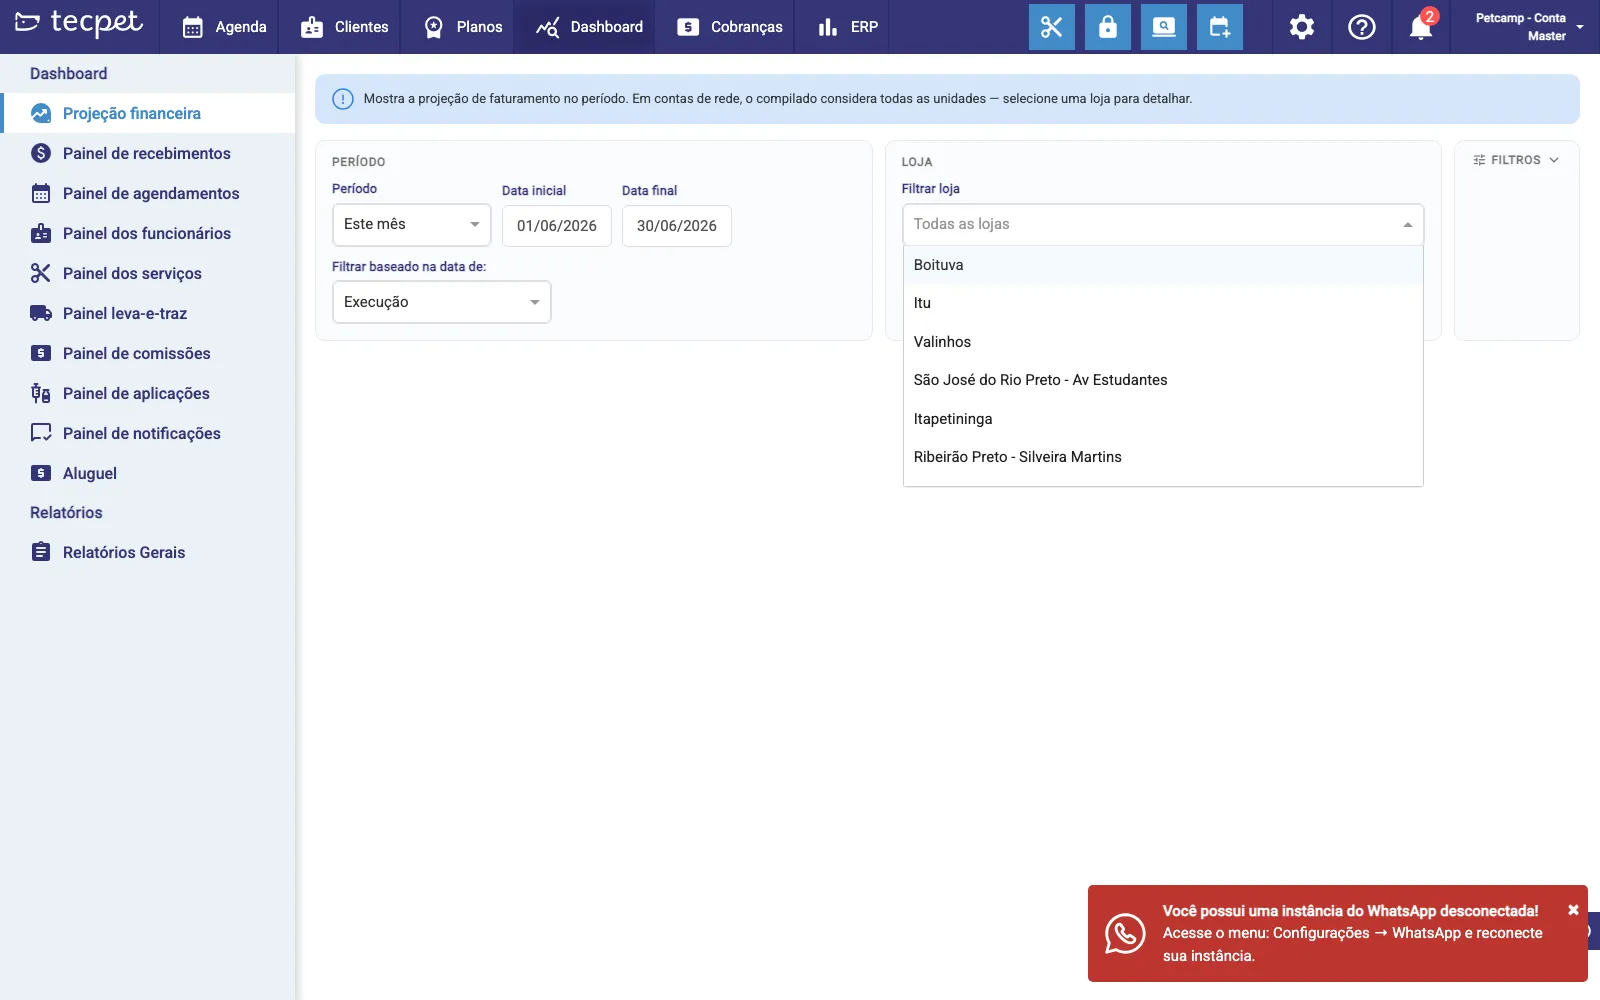
Section titled “What changes by account type”Head office
Since your account is the head office, all panels gain the Store filter: by default they show the whole-network rollup (“All stores”) and you can pick a unit to drill down. (See Network: head office and branches.)
Branch
Since your account is a branch, the panels show only your unit’s numbers — there’s no store filter. The consolidated network view lives in the head-office account.
You have a single store: the panels show your store’s numbers, with no store filter.