Dashboard: financial overview
The Dashboard brings together your business’s financial and operational view in panels. When you open it, you see the Service Projection (revenue for the period).
Panels and reports
Section titled “Panels and reports”The left menu gives you the panels: Service Projection, Service Revenue, Appointments panel, Staff, Services, pickup & delivery, Commissions, Applications and Notifications, plus Service Notes. Under Reports are the General reports and the ERP ones (Sales and Finance).
Revenue for the period
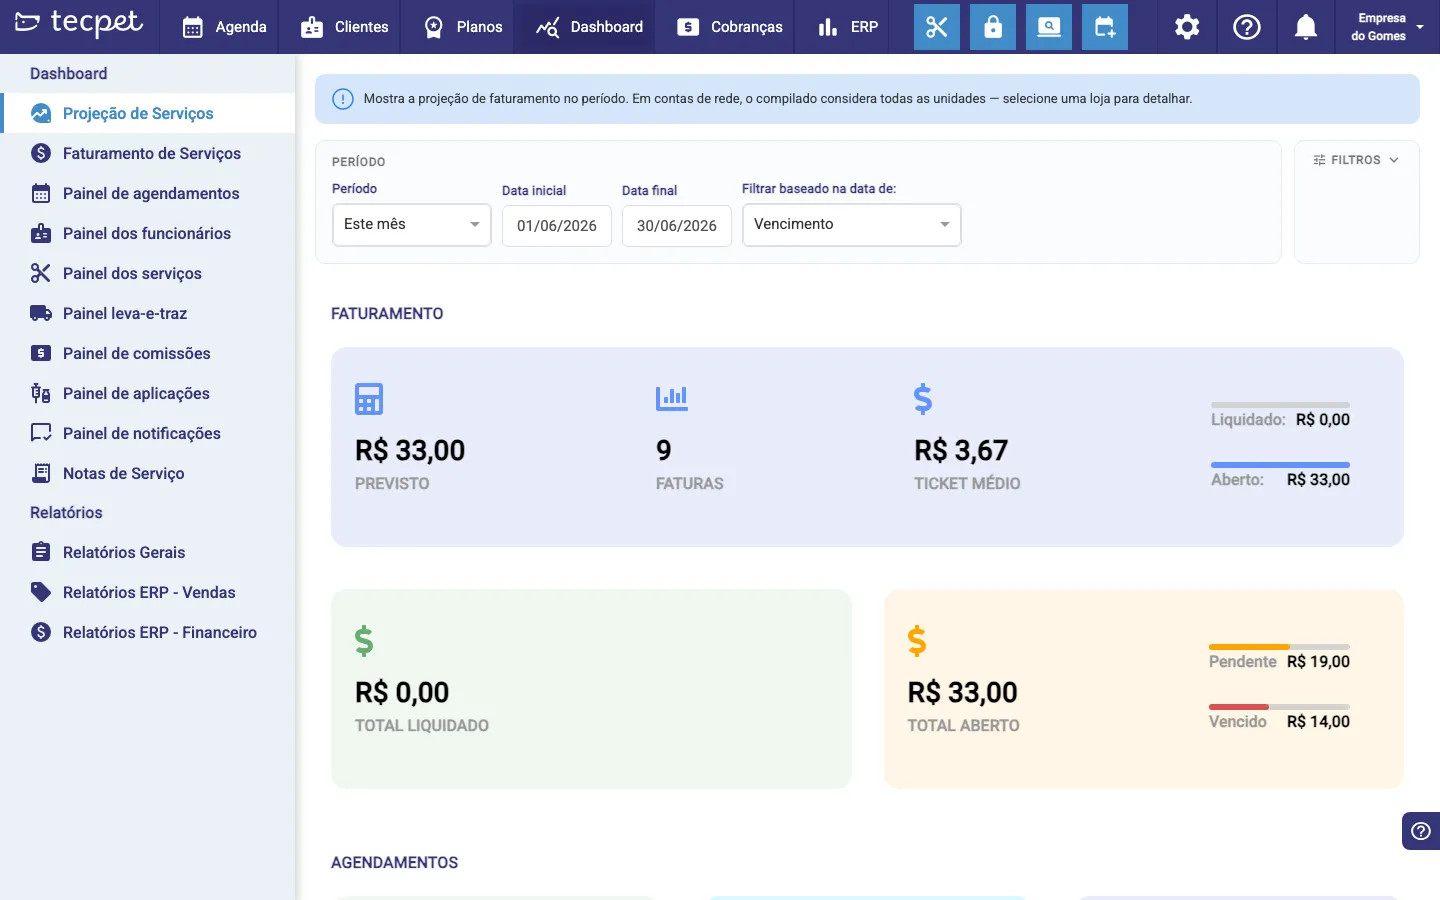
Section titled “Revenue for the period”The cards show the Forecast, the number of Invoices, the Average Ticket, the Total Settled (already received) and the Total Open — splitting what is Pending from what is Overdue.
Filter by period
Section titled “Filter by period”Use Period (e.g. This month) or the start/end dates, and choose whether the filter uses the Due date or the creation date. The Filters button opens extra options.